Difference between revisions of "ZYen:Financial Centre Futures Tools"
From ZYen
Marc morris (Talk | contribs) (Created page with "=[http://www.longfinance.net/component/gfcigraph/ GFCI Over Time]= The ‘[http://www.longfinance.net/component/gfcigraph/ GFCI Over Time]’ tool allows you to track the prog...") |
Marc morris (Talk | contribs) |
||
| Line 1: | Line 1: | ||
=[http://www.longfinance.net/component/gfcigraph/ GFCI Over Time]= | =[http://www.longfinance.net/component/gfcigraph/ GFCI Over Time]= | ||
| − | The ‘[http://www.longfinance.net/component/gfcigraph/ GFCI Over Time]’ tool allows you to track the progress of worldwide financial centres in terms of competitiveness. This uses data gathered throughout the history of the [[ZYen:Global Financial Centres Index|Global Financial Centres Index], which is produced bi-annually with the [http://www.zyen.info/gfci/ input] of financial services professionals worldwide. | + | '''The ‘[http://www.longfinance.net/component/gfcigraph/ GFCI Over Time]’ tool allows you to track the progress of worldwide financial centres in terms of competitiveness.''' This uses data gathered throughout the history of the [[ZYen:Global Financial Centres Index|Global Financial Centres Index], which is produced bi-annually with the [http://www.zyen.info/gfci/ input] of financial services professionals worldwide. |
==Example== | ==Example== | ||
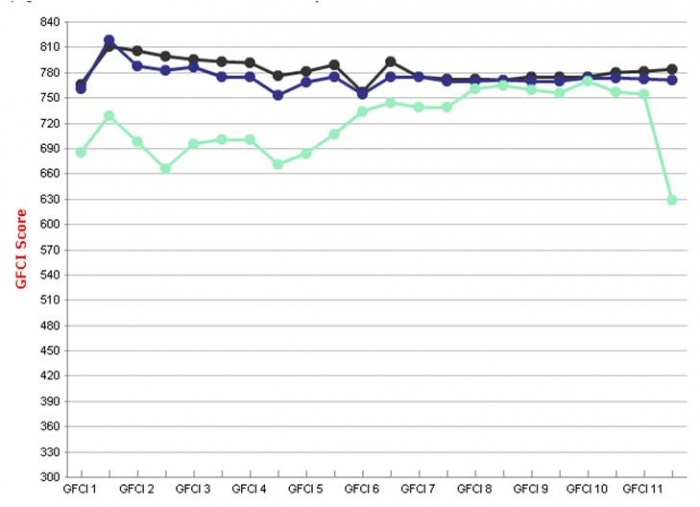
The graph below shows the performance – in terms of competitiveness – of London (Black), New York (Blue) and Hong Kong (Sea-Green). | The graph below shows the performance – in terms of competitiveness – of London (Black), New York (Blue) and Hong Kong (Sea-Green). | ||
Revision as of 13:08, 2 July 2012
GFCI Over Time
The ‘GFCI Over Time’ tool allows you to track the progress of worldwide financial centres in terms of competitiveness. This uses data gathered throughout the history of the [[ZYen:Global Financial Centres Index|Global Financial Centres Index], which is produced bi-annually with the input of financial services professionals worldwide.
Example
The graph below shows the performance – in terms of competitiveness – of London (Black), New York (Blue) and Hong Kong (Sea-Green).
